7 Steps to Creating an Infographic
An infographic, short for information graphics, is a visual representation of information or data. Infographics are becoming extremely popular for companies and businesses to relay information in a simple manner. Infographics are especially useful for sharing content that may be complicated or hard to understand. Visuals are often more memorable than reading text and can incite action from people.
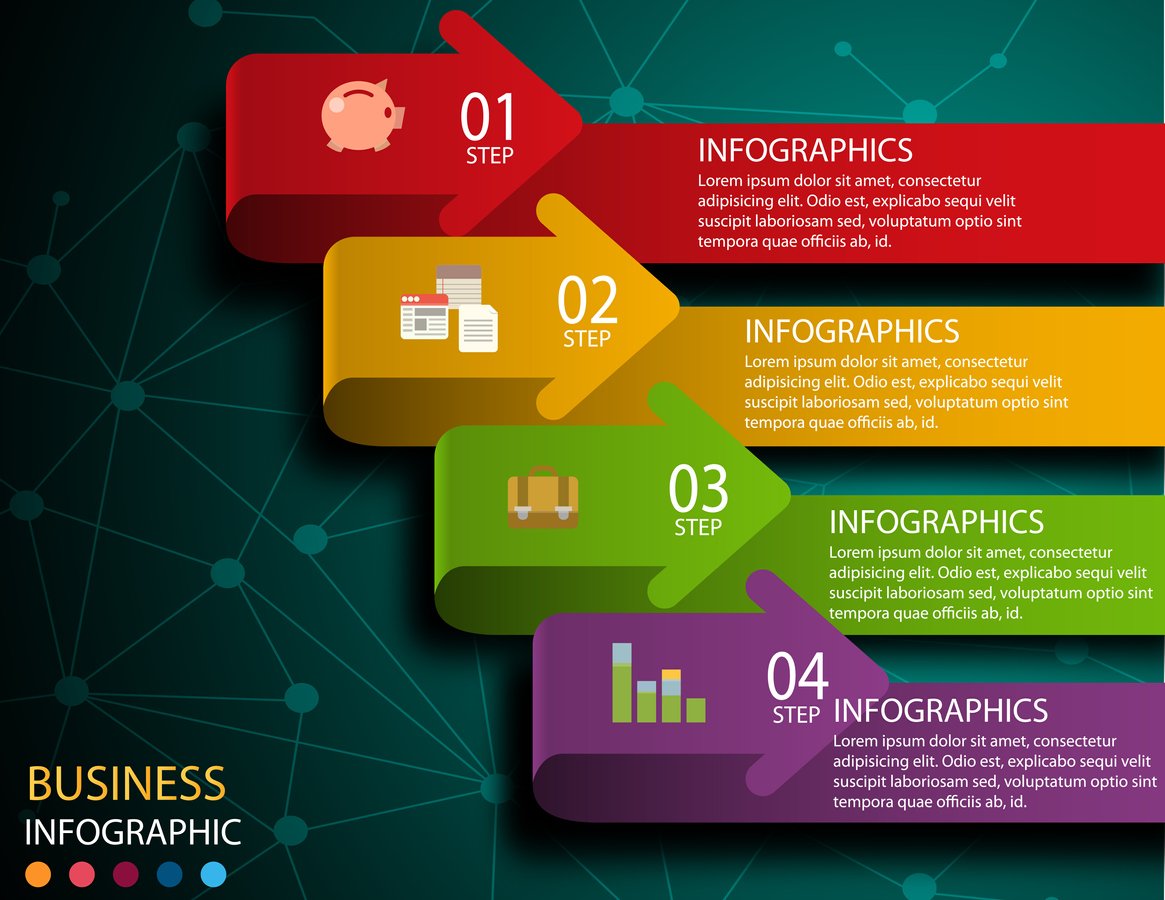
If you’ve never made an infographic before, below are 7 steps to creating an infographic in both infographic form and text form:
- Gather data to start developing the story you want to tell. Going through data is where the whole process begins and how you can get an idea of what your infographic is going to be about.
- Find the story within your research so you can begin to design your infographic. Make sure it is captivating and will draw the attention of viewers.
- Make a plan – don’t start your infographic without one. Laying out your infographic from start to finish will ensure the infographic runs smoothly and is easy to understand.
- Remember the importance of the visual aspect and remove as much text as possible. Infographics are all about creating visual representations of information as opposed to text. Don’t fill your infographic with too much text or else it will lose its purpose.
- Don’t include too many fonts and confuse your viewer. Fonts are great to differentiate pieces of information but too many of them can cause a headache for your viewer.
- Make sure your infographic is understandable and easy to read. If an infographic isn’t clear and possible to be understood, people won’t want to spend the time trying to understand what it means.
- Go back and review your infographic to make sure information is correct. When dealing with data and graphics, it’s really easy to make a mistake in communicating information.
When your infographic is ready to go, send it out and share it with your readers! By using these tips, you can ensure that that info graphic will make a statement and be useful to your readers. For more information on creating an infographic, click here.